


Introduction
Flicker, also known as temporal light modulation, refers to a rapid variation in the brightness of light over time [1]. Although flicker effects from commercial lighting are usually undetectable, it has been well documented that flicker from lighting systems can cause adverse health effects [1-3]; visible light flicker that occurs at a frequency below 60 Hz can cause headaches and seizures. Although flickers with a frequency of more than 100 Hz are not consciously perceived, invisible flickers may nonetheless have negative effects, such as eyestrain, headache, and impaired visual performance [4]. Invisible flicker was also reported to impair cognitive function, such as problem-solving performance [5]. Moreover, subjective evaluation of the light flicker at 100 Hz revealed that 100% modulation depth had undesirable effects, whereas 29% modulation depth and 0% control were acceptable to office workers [6]. However, to date, little is known about the neurophysiological mechanism by which light flicker conditions affect emotions and neurocognitive performance.
Light sources based on light-emitting diodes (LEDs) are becoming increasingly common for general lighting because of their high energy efficiency, long operational lifetime, and high durability compared with conventional light sources [7]. A forecast analysis predicted that LED lighting will reach a market share of 86% by 2035, which could reduce the United States lighting energy consumption by up to 75% from the baseline consumption in 2015 [8]; however, there is a wide variety of flicker characteristics in LED products on the market. LEDs driven to flicker at twice the alternating current (AC) power line frequency may have more pronounced flicker than fluorescent lamps [4]. To prevent adverse biological effects of light flicker, recommended practices were developed as follows: at a flicker frequency above 90 Hz, the depth of modulation should be less than 0.08×the flicker frequency for a low-risk and less than 0.0333×the flicker frequency for no observable effect [9]. Accordingly, it is conceivable that reducing the flicker below the level of no observable effect might mitigate the adverse effects affecting cognitive operations. However, there is currently no neurophysiological evidence to support this hypothesis.
Cognitive functions are largely dependent on appropriate large-scale integration between different brain regions [10]. Phase synchronization allows large-scale integration between remote brain regions, which is necessary for proper cognitive functioning [11]. In line with this, aberrant functional connectivity patterns have been observed in various neurological disorders, such as Alzheimer’s disease, Parkinson’s disease, and idiopathic rapid eye movement sleep behavior disorder [12,13]. Additionally, we previously found that color temperature of LED lighting influenced resting-state functional connectivity in healthy individuals [14]. Functional connectivity is defined as the statistical interdependence of neural activity between two different brain regions, which can be measured by the degree of phase synchronization of brain oscillations [15]. In particular, phase synchronization of theta-band oscillations has been reported to mediate inter-regional neural communication during memory tasks [1].6 Animal studies have shown that hippocampal theta activity is implicated in memory encoding and retrieval processes [17]. Human event-related potential (ERP) studies have demonstrated that an increase in theta activity contributes to the generation of the P300 component during memory tasks [18]. In this regard, investigating theta-band phase synchrony (TBPS) during cognitive tasks may allow us to assess the neurophysiological effect of light flicker on cognitive processes.
In this study, we used electroencephalography (EEG) to measure the neural activities of healthy participants while performing the Sternberg working memory task. Working memory refers to a cognitive system that temporarily stores and manipulates information to perform complex cognitive tasks [19]. The Sternberg paradigm has been commonly used in ERP studies to evaluate cortical activities related to working memory during memory-scanning tasks [20-22]. Then, we compared TBPS under the reduced flicker and ordinary flicker lighting to determine the effect of the flicker condition on neurocognitive processes. Considering the negative effect of the flicker on cognitive performance, we hypothesized that LED lighting with reduced flicker will enhance TBPS during memory retrieval compared with ordinary flicker lighting. As a measure of TBPS, we estimated the weighted phase lag index (wPLI) to minimize volume conduction effects from scalp EEG recordings [23]. In addition to TBPS analysis at the scalp level, we performed cortical source analysis to localize the significantly altered functional connections in the brain.
Methods
Study participants
We prospectively enrolled 30 healthy participants (mean age, 30.4±4.4 years; male, 66.7%) via advertisements from April to June 2016. The exclusion criteria were as follows: 1) history of neurological and psychiatric disorders, traumatic brain injury, and previous brain surgery and 2) use of medications affecting the central nervous system, including sleeping pills and antidepressants, within the last 2 weeks. Following eligibility screening, all participants provided written informed consent before enrollment in the study. Participants were then subjected to the Sternberg working memory tasks with ERP recordings under both reduced and control flicker lighting conditions. Among the 30 participants who completed the experiments, 11 were excluded from the analysis because their averaged ERP waveforms did not show typical ERP-like patterns, including the positive peak corresponding to the P300 component. Finally, the data from 19 participants (mean age, 30.4±4.5 years; male, 63.2%) were analyzed. This study was approved by the Institutional Review Board of Seoul National University Hospital (H-1601-043-733) and was conducted in accordance with the Declaration of Helsinki and Good Clinical Practice guidelines.
LED lighting
We used two different light flicker conditions in this study: reduced flicker lighting (percent flicker, 1.78%; flicker index, 0.28%) and control flicker lighting (percent flicker, 40.27%; flicker index, 13.37%) (Supplementary Fig. 1 in the online-only Data Supplement). Percent flicker, also known as modulation depth, is a measure of light flicker and is defined as (M-m)/(M+m) ×100, where M and m refer to the maximum and minimum light intensity during one cycle, respectively. The Flicker index is another metric for flicker measurements and is calculated using the light output curve. It is defined as the area above the mean light output of the light output curve divided by the total area under the light output curve [24]. As the frequency of the AC electricity supply is 60 Hz in our country, the flicker frequency is 120 Hz, and the percent flicker recommended for the low-risk and no observable effect level corresponds to <9.6% and <4.0%, respectively [9]. The control flicker lighting used in this study involved commercially available LED lights whose flicker was not consciously perceivable. There was no modification of the flicker parameters, such as the pattern, frequency, or intensity, for the control flicker lights. The reduced flicker lighting was designed to minimize light flicker, while the other light conditions remained the same. The brightness and color temperature of the LED lights were set at 500 lx and 4,000 K for both flicker conditions. The experimental space (width: 2 m, length: 2.5 m, and height: 2.7 m) was shielded by a blackout curtain to block ambient light. LED light panels (Mimi Lighting Inc., Incheon, South Korea) were installed on the ceiling, and no other light source was used in the experimental space. The light conditions were checked at the desk level (0.7 m). The flicker conditions of the LED lights were regulated by a controller during the experiments.
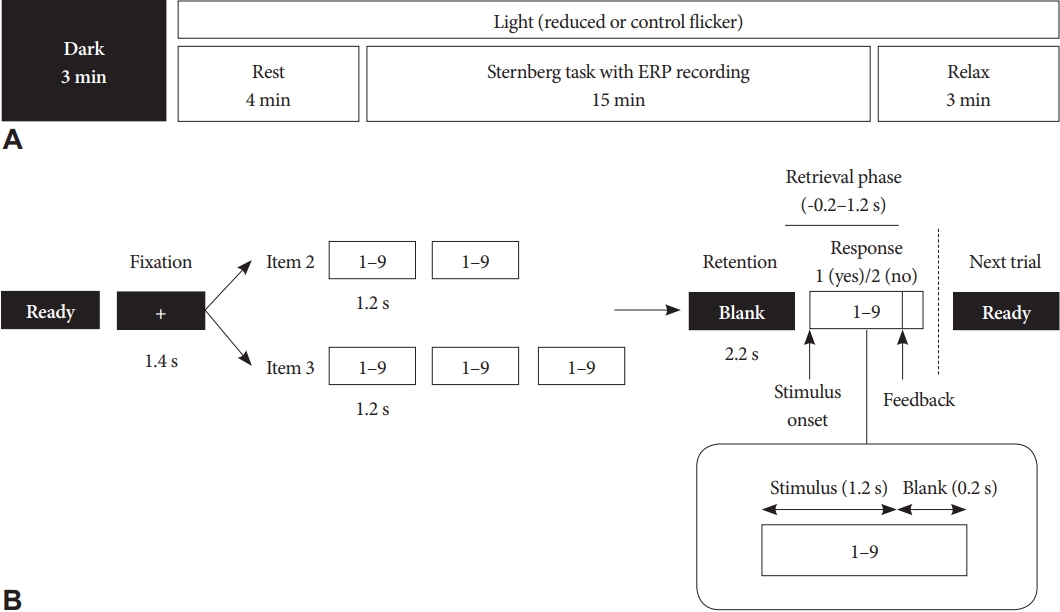
Before starting the experiment, the participants rested in the dark for 3 min. Following this, LED light was presented for a total of 22 min in the following sequence (Fig. 1A): resting (4 min), ERP (15 min), and relaxation (3 min). During the resting phase, the participants were adjusted to the light condition while alternately opening and closing their eyes every 1 min. Subsequently, the Sternberg working memory task was performed during the ERP period. At the end of the experiment, the participants relaxed for 3 min. Each participant performed the experiments under the two different flicker conditions (reduced and control), and the order of the flicker conditions was counterbalanced across the participants. All experiments were performed during the daytime between 10 AM and 4 PM.
Sternberg working memory task
The Sternberg working memory task was performed using Presentation® (Neurobehavioral Systems Inc., Berkeley, CA, USA) while recording EEG [22]. We used two memory loads (two or three items), which reflected the number of digits that the participants were required to memorize (Fig. 1B). Memory loads were randomly selected across trials so that the participants would be unaware of the number of digits they were expected to memorize. Each trial started when the participant pushed button 1. After a black cross bar was presented for 1.4 s for fixation, a series of digits (the memory set) were presented for 1.2 s at 0.2-s intervals. The screen was then blank for 2.2 s (retention phase), after which a test digit (the probe) was presented for 1.2 s. Then, the participants had to decide whether the probe was a member of the memory set and respond as quickly as possible by pressing one of two buttons (1, yes; 2, no). A feedback sound was given at the end of each trial; a “tada” sound indicated a correct response, whereas a “beep” sound indicated an incorrect response. The participants were exposed to 120 trials under both reduced flicker and control flicker conditions. Reaction time (RT) and hit rate (HR) were estimated as measures of behavioral performance. The participants performed working memory tasks while sitting on a chair. The distance between the participants’ eyes and the presentation monitor was 75 cm, and the visual angle was 1.91°. Stimuli were presented on a 15-inch monitor with a frame rate of 60 Hz and a resolution of 1,400×1,050 pixels.
ERP recording and preprocessing
During the Sternberg working memory task, scalp EEG was recorded with 60 cap-based electrodes (Quick-cap, Charlotte, NC, USA), which were placed according to the international 10–20 system. We used the average reference and set a bandpass filter from 0.1 to 70 Hz. The sampling rate was 400 Hz. The electrode impedances were kept below 5 kΩ.
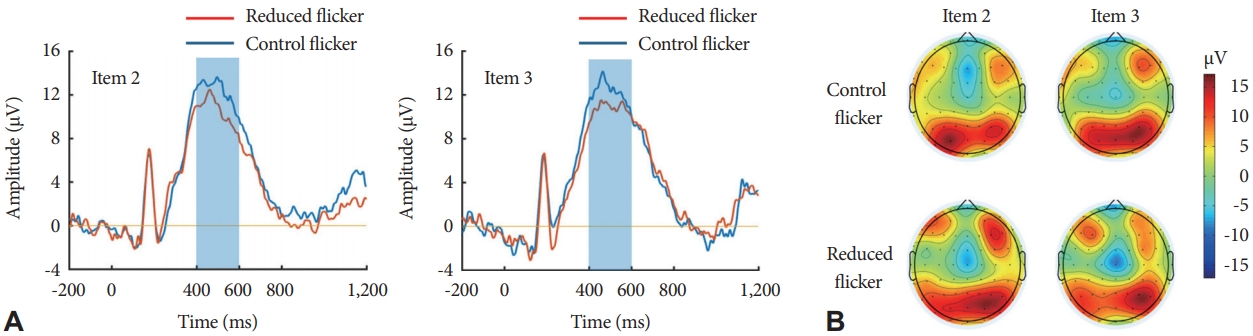
Preprocessing and analysis of the ERP data were performed using MATLAB (MathWorks, Natick, MA, USA). For each trial, ERP recordings were epoched into 1,400-ms segments (from -200 to 1,200 ms after the stimulus), which corresponded to the retrieval phase of the working memory task (Fig. 1). For each epoch, we performed a baseline correction using a pre-stimulus interval from -200 ms to 0 ms. Bad epochs were removed by visual inspection. Independent component analysis was then performed to remove typical artifacts such as blinks, eye movements, and muscle activities [25]. Finally, the current source density transformation was applied to minimize the volume conduction effect in the scalp EEG recordings [26]. Grand-averaged ERPs were plotted to define the P300 time window (Fig. 2A). ERP waveforms showed the typical P300 component ranging between 400 and 600 ms. The scalp topography of P300 demonstrated maximum positivity over the parietal cortex (Fig. 2B). Therefore, we assessed the mean P300 amplitude of the parietal region (P3, P4, and Pz) by averaging the time window of 400–600 ms.
Cortical source analysis
For cortical source analysis, standardized low-resolution brain electromagnetic tomography (sLORETA) was used to solve the inverse problem because sLORETA has the advantage of zero error localization based on images of standardized current density [27]. The head model was based on the FreeSurfer anatomy template constructed from an average of 40 participants using spherical averaging [28]. Using the Brainstorm toolbox, 60 EEG-channel locations were aligned with the selected head model [29]. For solving the forward and inverse problems using the Brainstorm toolbox, we selected regions of interest (ROIs) based on the theta-band source topography of the ERP P300 component as well as the clinical relevance of the cognitive functions (Table 1). The centroid seed for each ROI was chosen because of the low spatial resolution of sLORETA.
Functional connectivity analysis
We estimated the TBPS by measuring wPLI within the P300 time window (400–600 ms). EEG connectivity with zero phase lags contributes to spurious functional connectivity, which results from volume conduction to the scalp electrodes. The phase lag index (PLI) was originally developed to measure non-zero phase lags between two time series data by averaging the sign of the imaginary part of the cross-spectrum. As a modified version of PLI, wPLI is weighted by the magnitude of the imaginary component of the cross-spectrum to minimize the sensitivity to volume conduction and noise while increasing the capacity to detect changes in phase synchronization [23].
To extract the characteristic of phase perturbation at the theta band from EEG signals, a band-pass filter was adapted with a second-order Butterworth filter at a 4–6 Hz frequency band. Cross-spectrum X was computed for electrodes i and j using the extracted complex-valued Hilbert spectra vector Z,
Therefore, we estimated the wPLI between the two signals, i and j, which is defined as:
N is the total number of epochs, and θ (Xi,j) is the difference in the phase of cross-spectrum X between signals i and j. The wPLI ranges between 0 and 1, where 0 indicates no coupling, and 1 indicates perfect phase locking between the two signals. Baseline corrections were applied by subtracting the wPLIs at the baseline interval (-200–0 ms). Finally, we averaged the normalized wPLIs over the P300 time window (400–600 ms).
TBPS was calculated based on the theta-band wPLI for 1,770 connections between the scalp electrodes and 44 connections between the cortical sources. Thereafter, we compared the overall TBPS according to the two flicker conditions and two memory loads. In addition, we performed pairwise comparisons to identify significantly altered functional connections using reduced flicker light.
Statistical analysis
Repeated-measures analysis of variance (ANOVA) was used to determine the effect of flicker conditions and memory loads on working memory performance, ERP P300 amplitudes, and TBPS. Within-subjects factors included flicker conditions (reduced vs. control) and memory loads (item 2 vs. 3). Post-hoc comparisons between the two flicker conditions were performed using the Wilcoxon signed-rank test. Statistical significance was set at a two-tailed p-value<0.05. In addition, pairwise comparisons of TBPS between the two flicker conditions were performed using the non-parametric permutation test [30]. Pairwise comparisons of functional cortical source connectivity were subjected to a false discovery rate (FDR) of <0.1 in order to control the type I error rate.
Results
Behavioral performances during working memory tasks
Behavioral performance was measured by HR and RT during the Sternberg task (Table 2). For all memory loads, the mean HR was 98.94% under the control flicker condition and 98.51% under the reduced flicker condition. There was no significant main effect of flicker on HR (F1,18=0.862, p=0.365) and RT (F1,18=0.021, p=0.887). However, we observed a significant main effect of memory load on HR (F1,18=5.743, p=0.028) and RT (F1,18=29.381, p<0.001), indicating a significant decrease in HR and increase in the RT as the memory load increased. No interaction between flicker and memory load was observed in HR (F1,18=0.064, p=0.803) and RT (F1,18=0.470, p=0.502). Taken together, the working memory performance did not differ according to the flicker conditions of LED lighting.
P300 component of ERPs
We analyzed the effect of light flicker on the mean P300 amplitude during working memory tasks. Repeated-measures ANOVA showed that the flicker condition had no significant effect on the parietal P300 amplitude (F1,18=3.992, p=0.061) (Fig. 2A). In the frontal and central regions, there was no significant difference in the P300 amplitude according to the flicker condition (Supplementary Fig. 2 in the online-only Data Supplement). Neither the main effect of the memory load (F1,18=0.006, p=0.941) nor the interaction between the flicker and memory load (F1,18=0.578, p=0.857) on the P300 amplitude were significant.
TBPS from scalp EEG recordings
We analyzed the effect of light flicker on TBPS from scalp EEG recordings. Fig. 3A represents TBPS with the highest 5% wPLI under both control and reduced flicker light. The number of significant theta-band functional connections in the reduced flicker condition were 1.6- and 2.6-fold greater than those in the control flicker condition (90 vs. 55 at memory load 2; 123 vs. 48 at memory load 3). Then, we measured the overall TBPS by averaging the wPLI over the total 1,770 electrode pairs (Fig. 3B). The main effect of flicker was marginally significant (F1,18=4.431, p=0.050). The post-hoc analysis showed that TBPS under the reduced flicker light was significantly higher than that under the control flicker light at memory load 3 (0.030 vs. 0.013, p=0.002). However, the difference in TBPS between the two flicker conditions was not significant at memory load 2 (0.040 vs. 0.030, p=0.227).
Thereafter, we performed pairwise comparisons of 1,770 electrode pairs between the two flicker conditions. The reduced flicker light significantly enhanced TBPS compared with the control flicker light at both memory loads (unadjusted p<0.0025) (Fig. 3C). The increased TBPS under the reduced flicker condition was remarkable at memory load 3, which mainly involved the frontoparietal connections. Taken together, the reduced flicker lighting enhances the EEG theta-band functional connectivity at the scalp level compared with the control flicker lighting, especially when processing higher memory load tasks.
TBPS between cortical sources
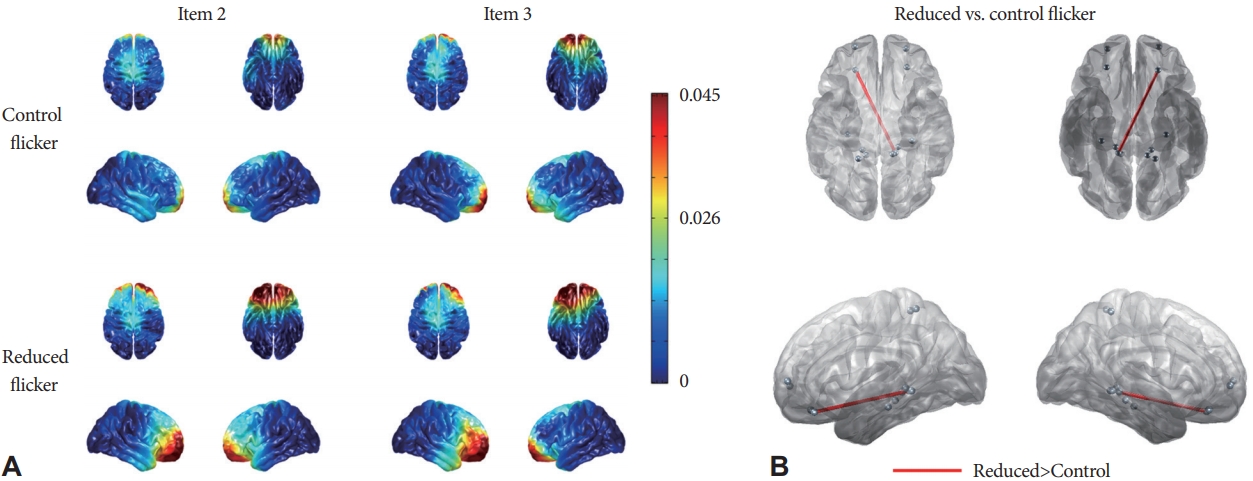
EEG source imaging with sLORETA showed that the sources of theta oscillations of the ERP P300 component were mainly located in the bilateral prefrontal areas (Fig. 4A). In addition to the prefrontal lobe (BA 10 and 11), we included the hippocampus (BA 27, 28, and 35) and parietal lobe (BA 5) as ROIs, considering their functional roles in working memory processes (Table 1). Theta-band source activity in the prefrontal cortex was not significantly different between the two flicker conditions (memory load 2, p=0.108; memory load 3, p=0.3981). Cortical source activity in the other ROIs did not differ between the two flicker conditions.
Next, we measured the TBPS between the cortical sources and compared them between the two flicker conditions. At memory load 3, the reduced flicker light significantly increased TBPS between the left prefrontal cortex and right hippocampus compared with the control flicker light (FDR<0.1) (Fig. 4B). However, there was no significant difference in the TBPS between the two flicker conditions at a memory load of 2. The results from the cortical source analysis confirmed that the reduced flicker light increased theta-band functional connectivity compared with the control flicker light during the working memory process.
Discussion
In this study, we evaluated the effect of LED flicker on brain oscillations during working memory tasks. The data from our experiments showed that behavioral performance and parietal P300 amplitude did not differ significantly when the flicker level was reduced. However, the functional connectivity data demonstrated that the reduced flicker light significantly enhanced TBPS compared with the control flicker light. Furthermore, the cortical source analysis confirmed that the thetaband connection between the left prefrontal lobe and right hippocampus significantly increased under reduced flicker light compared with the control flicker light. To the best of our knowledge, this is the first neurophysiological study to demonstrate that theta-band functional connectivity during cognitive functioning is modulated by the degree of light flicker.
EEG signals provide valuable information on oscillatory brain activity according to different frequency bands, which subserve distinct neural processes and have different functional significance [31]. Theta-band oscillations, the main topic of this study, have been implicated in memory processes, especially encoding and retrieval of episodic memory [32,33]. A major role of theta activity in the working memory process has also been reported [34]. Working memory function was associated not only with local theta activity but also with interregional theta synchronization [35,36]. Previous studies found that TBPS between the hippocampus and medial prefrontal cortex was associated with memory encoding, retrieval, and integration [37,38]. Increased TBPS between the frontal and temporal regions was also observed during episodic novelty processing, suggesting its association with memory retrieval and encoding of novel stimuli [39]. Collectively, theta-band coupling is considered a neurophysiological correlate of interregional communication associated with memory processing. In this regard, the TBPS findings of the current study imply that reduced flicker light may contribute to improved neural processing during the working memory task.
We evaluated the P300 component and TBPS during the retrieval phase of working memory. Retrieval from working memory is implicated in several cognitive operations, such as stimulus evaluation, memory search, and decision-making [40]. The P300 component is considered as an electrophysiological marker of cognitive processes during working memory retrieval [20,21]. In particular, the later P300 subcomponent, corresponding to a time window of 400–600 ms in this study, was found to reflect active memory searching in the ventrolateral prefrontal cortex as well as storage buffer operations in the posterior parietal cortex [40]. Therefore, our ERP results suggest that reduced flicker lighting enhanced the brain network activity associated with memory retrieval. However, no significant differences were observed in behavioral performance between the two flicker conditions. One possible explanation is that the working memory tasks used in this study were too easy to differentiate between performance changes in young healthy participants. In other words, when performing tasks with low memory loads, little mental effort is required to activate the working memory system, which is called a floor effect [41]. It is also in agreement with our observation that the increase in TBPS under the reduced flicker condition was found only at higher memory loads. Nevertheless, our results provide neurophysiological evidence that LED flicker influences functional connectivity and neurocognitive processing. Based on these data, we suggest that reduced flicker LED light could be useful in environments demanding higher working memory performances, such as schools, offices, and laboratories.
The scalp topography of TBPS showed increased connections between the frontal and parietal regions under reduced flicker light. These results are in agreement with previous studies suggesting that theta synchronization between anterior and posterior brain regions significantly increased during the working memory processes [42,43]. More specifically, EEG source functional connectivity with sLORETA revealed that the reduced flicker light enhanced TBPS between the prefrontal cortex and hippocampus. It has been well established that interactions between the medial prefrontal cortex and hippocampus are implicated in memory encoding and retrieval processes [44]. EEG and MEG studies have also demonstrated that this interregional communication during the cognitive process is mediated by phase synchronization of theta frequency oscillations [37,38]. Collectively, our results indicate that the reduced flicker light improves the efficiency of information transfer within the functional brain network and consequently contributes to facilitating working memory operations.
A limitation of this study is that the functional connectivity changes only represented short-term responses with an exposure time of 19 min. Therefore, the long-term effects of LED flicker on functional connectivity and cognitive performance should be determined in future studies. Furthermore, the fact that data from 11 participants were excluded from the analysis is another significant limitation. Although those excluded failed to show typical ERP waveforms, this selection might have biased the results of this study. We evaluated slow theta oscillations of 4–6 Hz because the effect of the flicker condition was significantly observed only in this frequency range. Therefore, these results should be carefully interpreted.
In summary, we found that reduced flicker LED light increased theta-band functional connectivity during the working memory task compared with the control flicker light. Cortical source imaging showed enhanced TBPS between the hippocampus and prefrontal cortex under reduced flicker conditions. Therefore, reduced flicker light may facilitate working memory processes. LED lighting with reduced flicker should be considered in an environment that requires high-level cognitive performance.